Top 10 Healthy Snack Types for Global Buyers
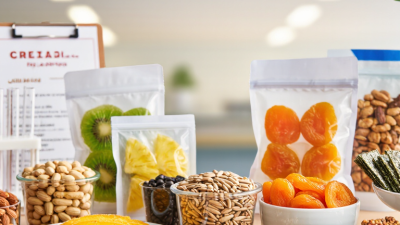
Global buyers are seeking snacks that support wellness without sacrificing taste, convenience, or commercial value. This guide explores the top 10 healthy snack types across different markets, from roasted nuts and dried fruit to whole-grain bites and protein-rich options. Each category offers distinct benefits, packaging needs, and sourcing considerations. A crunchy chickpea snack may appeal to office workers, while unsweetened fruit cups can suit families and school-focused retailers. Small details matter, including portion size, moisture control, resealable packaging, and clear allergen information.
Reliable purchasing requires more than attractive nutrition claims. Buyers should review ingredient lists, nutrition panels, shelf-life data, supplier audits, and applicable food standards in each destination. Certifications can strengthen trust, but they should be verified rather than assumed. Taste testing also deserves attention. A product may look excellent on paper but fail after several weeks on a store shelf. Not every “healthy snack” fits every consumer, budget, or culture. That is worth remembering.
This overview combines practical buyer experience with evidence-based considerations and realistic market questions. It considers texture, portability, storage stability, and product transparency. It also recognizes that healthier choices can still contain added sugar, sodium, or common allergens. No category is perfect. The strongest products usually balance nutrition, flavor, safety, price, and dependable supply. For global buyers, that balance can guide better sampling decisions, more credible product comparisons, and long-term partnerships with responsible manufacturers.
Defining Healthy Snacks: WHO’s <10% Free-Sugar Benchmark for Global Buyers
For global buyers, “healthy” should begin with a measurable standard, not packaging language.
WHO recommends limiting free sugars to less than 10% of daily energy intake. A further reduction below 5% may provide added benefits. Free sugars include added sugars, honey, syrups, and fruit juice concentrates. They differ from the natural sugar in whole fruit and plain milk. This distinction matters when comparing suppliers across countries.
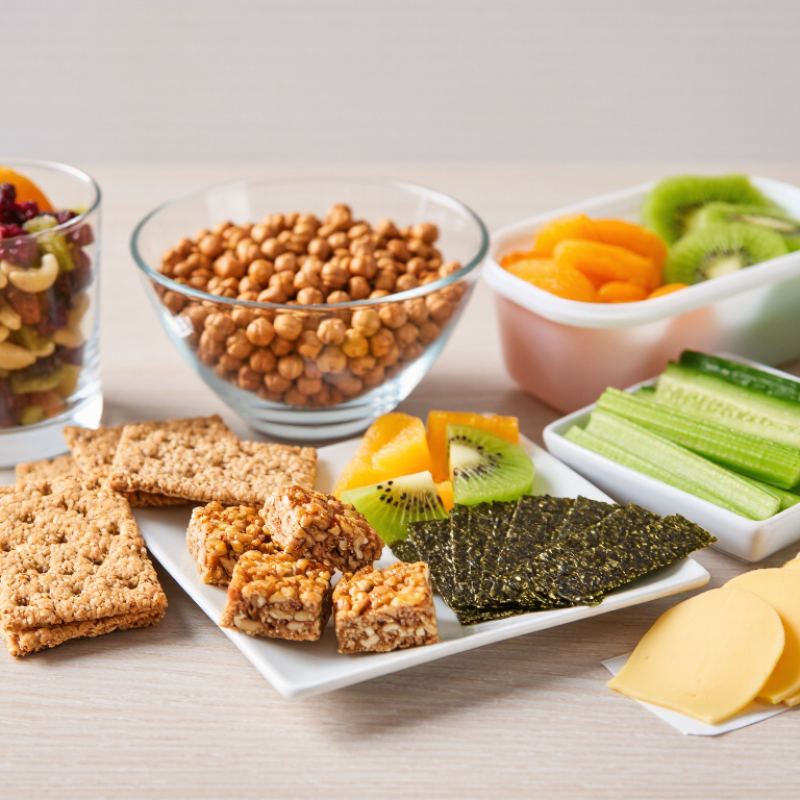
The ten practical snack types include fresh fruit, unsalted nuts, seeds, plain yogurt, raw vegetables, bean dips, whole-grain crackers, roasted legumes, air-popped popcorn, and boiled eggs.
These choices can provide fiber, protein, healthy fats, or useful micronutrients. They also need careful checking. Unsweetened dried fruit still contains concentrated sugars. Flavored yogurt may contain more free sugar than expected. A small label detail can change the product’s nutritional value.
During supplier reviews, compare free sugar per 100 grams and per serving.
Check the ingredient list, serving size, allergen statement, and storage requirements. For cross-border trade, request current laboratory reports when claims appear unclear. Local labeling rules differ, so nutrition professionals should review market-specific wording. A practical limitation remains: WHO’s benchmark applies to total daily intake, not a universal pass-or-fail rule for every snack. Portion guidance can be difficult. Consumers may eat several “small” servings without noticing the total sugar.
Top 10 Snack Types by Nutrition Profile, Ingredients, and Global Demand
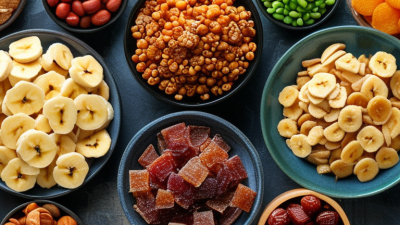
Healthy snack demand is shaped by nutrition, familiar ingredients, price, and shelf life. Nuts and seeds offer unsaturated fats, protein, and minerals, but salted versions can add substantial sodium. Dried fruit is portable and fiber-rich; small portions help keep concentrated sugars in perspective. Roasted chickpeas and lentils bring plant protein and crunch. Whole-grain crackers can add fiber, though recipes vary widely. Check the ingredient list.
Air-popped popcorn is a light whole-grain option when toppings stay modest. Plain yogurt snacks provide protein and calcium, but often need refrigeration. Fruit-and-nut bars travel well; some contain more syrup than expected. Seaweed snacks are crisp and light, yet sodium levels differ. Vegetable crisps may sound wholesome, but frying and seasoning can narrow their nutritional advantage. Labels matter.
Seed-based bites round out the ten types, combining ingredients such as pumpkin seeds, oats, and dried fruit. Global buyers may favor products that tolerate heat, humidity, and long shipping, so nuts, legumes, and dried fruit often have practical appeal. Demand is not uniform: local tastes, affordability, allergens, and storage access all influence choices. This ranking is imperfect; “healthy” depends on portion size, recipe, and the person eating it.
Top 10 Healthy Snack Types for Global Buyers
Protein and dietary fiber in representative snack foods, per 100 g
Values are approximate grams per 100 g, based on representative food-composition entries from USDA FoodData Central. Nutrition varies by variety and preparation. These examples illustrate nutritional profiles relevant to global sourcing; they do not represent sales or market-demand rankings.
Protein-Rich Snacks: Comparing 20–30 g Protein Claims Across Market Categories
Protein-rich snacks can deliver 20–30 g of protein, but the number means little without serving size and food category. A bar may provide 20 g in one compact portion, while jerky reaches a similar amount through concentrated meat. Roasted chickpeas or other legumes often need a larger, crunchier serving to approach that range. Different formats, different trade-offs.
Compare the protein claim with calories, sodium, added sugars, and fiber on the nutrition panel. Dairy-based snacks can offer complete protein, while plant-based options may combine sources such as peas and grains. Check the ingredient list and serving weight rather than relying on front-of-pack wording. A 30 g claim is not automatically a better choice than 20 g. It may simply come with more calories or a larger portion. I’d be cautious about treating protein as the only measure of a snack’s quality; it’s an easy detail to overvalue.
Tips: Match the portion to your appetite. For a quick desk snack, compare single-serve packs side by side. Notice how salty the jerky tastes, or how filling a legume snack feels. Labels help, but your actual portion matters too.
Plant-Based and High-Fiber Snacks: Applying FDA’s 3 g Fiber-per-Serving Standard
For global buyers comparing plant-based snacks, fiber is a useful place to start. FDA labeling guidance generally treats 10% of the Daily Value as “good source”; with a 28-gram Daily Value, that is about 3 grams per serving. It is a helpful benchmark, not a complete measure of nutritional quality. Check the serving size, since a small package may list a modest portion that shoppers rarely eat.
Roasted chickpeas, lentil crisps, oat bites, and seed-and-fruit mixes can offer practical options. Look at the Nutrition Facts panel rather than relying on words like “plant-based” on the front. A 30-gram serving with 3 grams of fiber is different from a larger serving that reaches the same amount. Small details matter. Also review added sugars, sodium, and saturated fat; fiber alone cannot tell the whole story.
Texture and portion size matter in real use. A crunchy bean snack may suit a desk drawer, while a chewy oat square travels better but can contain added sweeteners. Compare products using the same serving weight when possible. That takes extra effort. I would not treat 3 grams as a magic cutoff: recipes vary, labels can be easy to misread, and taste still affects whether people choose the snack again.
Global Buyer Checklist: Safety, Labeling, Certifications, Shelf Life, and Price Data
For nuts, dried fruit, roasted legumes, and whole-grain bars, a buyer checklist should start with hazards, not health claims. Request recent microbiological and contaminant test results, allergen controls, and traceability records for each lot. Check that certification is current, covers the actual factory and product category, and can be verified with its issuer. A certificate alone is not proof of every shipment’s quality. Small details matter.
Labels need review for the destination market: ingredient order, allergen declarations, nutrition values, net weight, and date coding. Confirm translations against the approved artwork, then compare a production sample with the final label. For shelf life, ask for real-time test data under stated storage conditions and packaging specifications. A crisp chickpea snack can soften quickly if its pouch admits moisture. I would not rely on a supplier’s best-case date alone.
Price comparisons should use the same pack size, delivery terms, and quality specification. The FAO Food Price Index averaged 124.0 points in 2023, 13.7% below 2022, illustrating how input benchmarks can move; it is not a finished-snack price index (FAO, 2024). FAO estimated that 13.2% of food was lost between harvest and retail in 2021, supporting close attention to handling and shelf-life performance (FAO, 2023). Some paperwork still looks reassuring before a careful audit. Check the evidence.